
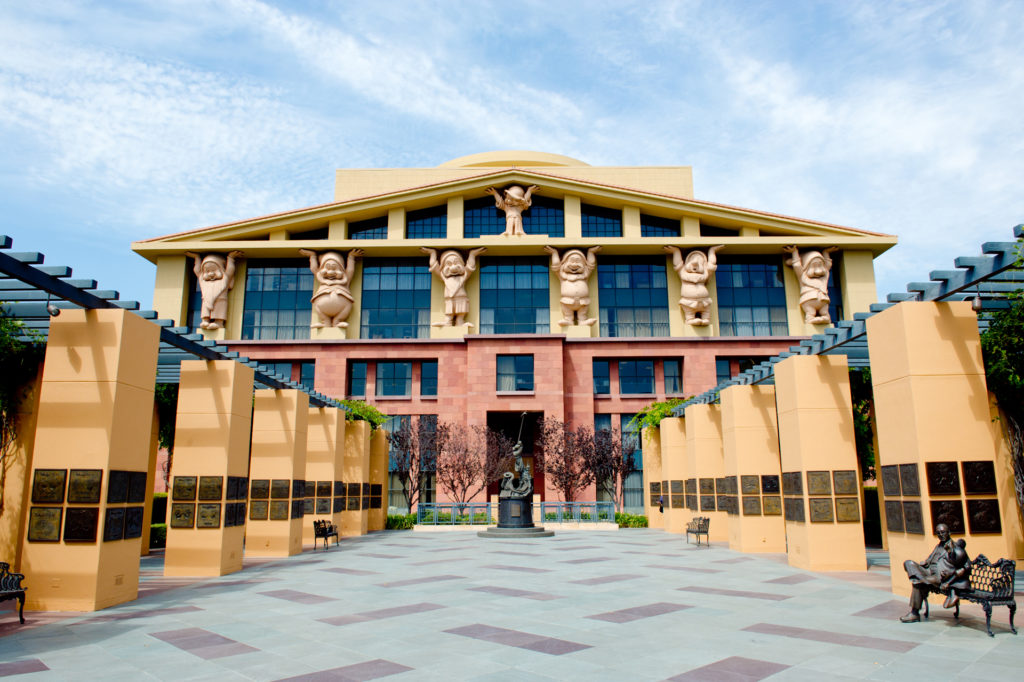
About The Walt Disney Company
Our Mission
The mission of The Walt Disney Company is to entertain, inform and inspire people around the globe through the power of unparalleled storytelling, reflecting the iconic brands, creative minds and innovative technologies that make ours the world’s premier entertainment company.
Investor Relations
Our commitment to creativity, technology and innovation generates unparalleled experiences that drive long-term value for our shareholders.
Executive Leadership
Our senior executives bring tremendous experience, visionary thinking and a shared commitment to excellence, creativity and innovation to the day to day operation of the company.
Board of Directors
The Walt Disney Company’s Board of Directors hail from renowned global organizations and industries, bringing a diverse range of knowledge, perspective and experience to guide and drive long-term value to the company.
Our Businesses
The Walt Disney Company, together with its subsidiaries and affiliates, is a leading diversified international family entertainment and media enterprise that includes three core business segments: Disney Entertainment, ESPN, and Disney Experiences.
Disney Entertainment
Disney Entertainment includes the company’s full portfolio of entertainment media and content businesses globally, including streaming. For the General Entertainment press site, click here.


ESPN
ESPN, the world’s leading multiplatform sports entertainment brand, features seven U.S. television networks and the preeminent direct-to-consumer sports offering in the ESPN app, leading social and digital platforms, ESPN.com and ESPN Audio. Outside the U.S., ESPN reaches sports fans globally through 43 linear networks across 130 countries and territories and via streaming, where ESPN live events are available on Disney+.
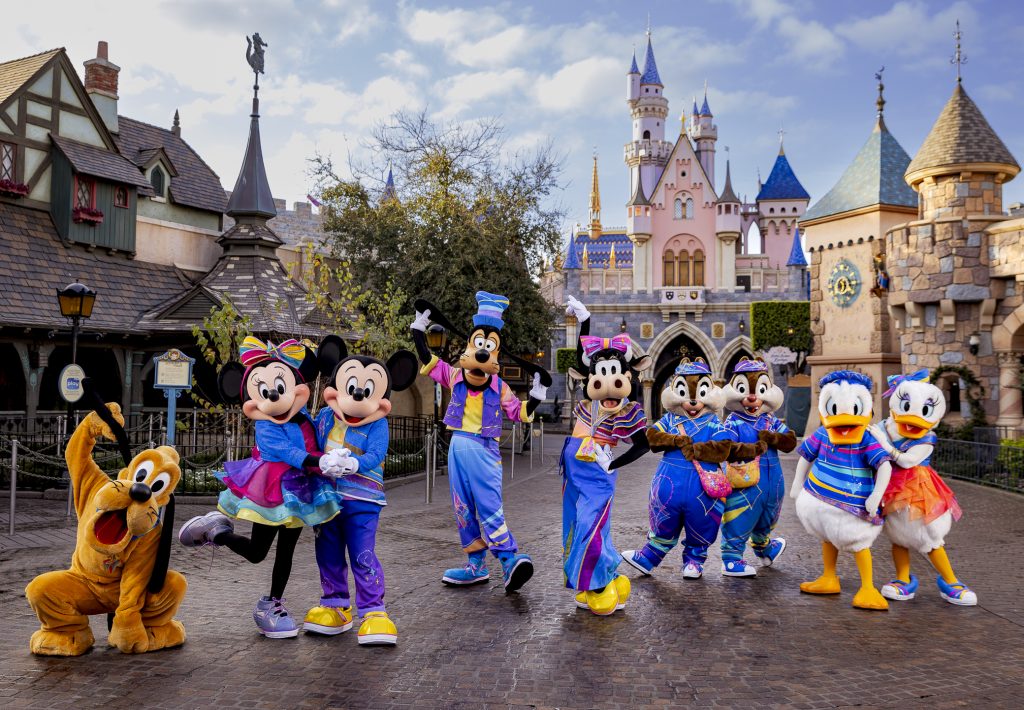
Disney Experiences
Disney Experiences is the global hub that brings Disney’s stories, characters, and franchises to life through theme parks and resorts, cruise and vacation experiences, and consumer products — everything from toys to apparel to books.