
Environmental Sustainability
The Walt Disney Company is committed to taking meaningful and measurable action to support a healthier planet for future generations as we operate and grow our business.
Goals & Targets

Emissions

Water

Waste

Materials

Sustainable Design
Our Impact
The Walt Disney Company’s commitment to environmental stewardship goes back to our founding nearly 100 years ago. Here are just a few ways we are focused on helping to protect the planet we all share.
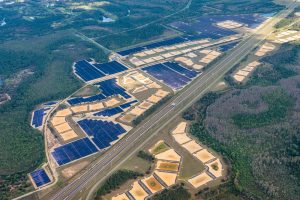
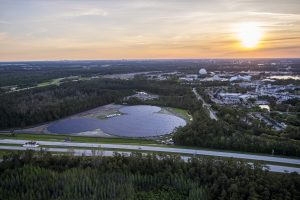
Reducing Emissions
Walt Disney World® Resort and Reedy Creek Improvement District teamed up with local utility partners to begin development of two new 75MW solar facilities. When they come online, the new facilities, paired with two existing facilities, are projected to bring the Walt Disney World Resort’s renewable energy consumption up to nearly 40% of its annual total power use.
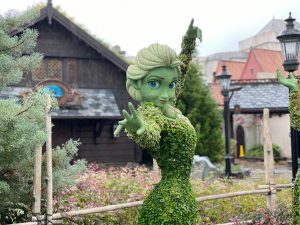
Conserving Water
Through water conservation efforts and use of reclaimed water, we are working to reduce potable water consumption at our operations. Recent efforts at our theme parks and resorts include using artificial turf and implementing a sophisticated irrigation control system at Disneyland Resort as part of drought fighting efforts.
Reducing Waste
We eliminated single-use plastic straws and stirrers at all owned and operated locations globally, a reduction of more than 175M straws and 13M stirrers per year. Meanwhile, organic waste from Walt Disney World is sent to an off-site composting facility where it is turned into a nutrient-rich soil product and can be used to fertilize onsite plants.

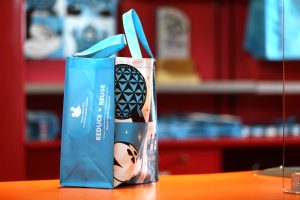
Lower Impact Products
We redesigned our iconic Core Classic dolls to feature plastic-free packaging that is made of 100% recyclable, sustainably sourced paper. It’s also easier to open than traditional packaging, providing a more accessible unboxing experience for kids and families.
Building Sustainably
In collaboration with design teams across the company, and leveraging the creative expertise of our Disney Imagineers, we have established a new, rigorous set of internal Sustainable Design Standards, aligned with our 2030 goals.
Greening Production
Across hundreds of film and TV productions created by our studios each year, including Star Wars’ “The Mandalorian,” we are focused on reducing waste, switching to low emissions energy sources, and educating cast and crew on environmental best practices.
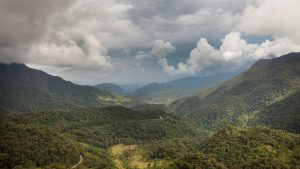
Protecting Nature and the Climate
For over a decade, Disney has invested in nature-based climate solutions. These natural places provide habitats for animals and resources for local communities, including food, shelter, and income, all while helping reduce the impact of climate change.
125K+
tons operational waste diverted from landfills in FY22
200+MW
Solar capacity commissioned or announced as of FY22
96
Environmental Media Association awards won in 2022
2030 Environmental Goals
Reducing Our Emissions
Since 2009, Disney has operated under a long-term vision to reach net zero greenhouse gas emissions. In December of 2022, we announced our latest goals to help advance us on that path and plan to submit our goals to the Science-Based Targets initiative (SBTi) for validation.
To achieve our fact-based Scope 1 & 2 emission reduction targets, as well as our net zero emissions goal, we are addressing our emissions footprint first through avoided emissions, and then through emission reductions wherever possible, including by investing in energy efficiency and low-carbon fuel innovation, and by powering our operations with zero carbon electricity.
We have also set a goal to reduce our greenhouse gas emissions beyond our direct operations to include the production and delivery of our products and services, commonly referred to as Scope 3 emissions. Our ability to meet these goals depends on several external factors, including actions by our suppliers, transitions to cleaner fuels, economically feasible solutions at scale, and consumer behavioral changes. Industry collaboration is key to addressing some of these challenges.
Reducing Our Emissions
- Reduce absolute emissions from direct operations (Scope 1 & 2) by 46.2% by 2030, against a 2019 baseline
- Achieve net zero emissions for direct operations by 2030
- Reduce Scope 3 emissions in line with a ‘well below 2°C’ scenario by 2030
- Purchase or produce 100% zero carbon electricity by 2030
- Invest in natural climate solutions
Protecting Water Resources
Water Stewardship: At Disney, we recognize that water is essential for ecosystems and a vital resource for communities and our operations around the world. We also recognize that water is a highly local issue, with unique considerations in each geography. In keeping with the latest data and standards, each of our high water impact sites around the world will implement localized watershed stewardship strategies, focusing on both water conservation within our operations and investments to conserve and protect local natural water systems.
Since 2014, the Disney Conservation Fund has awarded more than $2.0 million to non-profit organizations supporting these water stewardship efforts.
Responsible Seafood: Responsible selection and sourcing of seafood is important to the future of our business, to the livelihoods of the fishing industry worldwide, and to the health of the planet for future generations. In fiscal 2022, our U.S. parks, resorts, and cruise line sourced nearly 100% sustainable seafood.
Protecting Water Resources
- Implement localized watershed stewardship strategies
- Source sustainable seafood
Using & Wasting Less
Since 2009, Disney has operated under a long-term vision to achieve zero waste in our operations. We have made significant progress toward this goal including through a series of waste management initiatives to reduce, reuse, recycle, donate, and encourage behavior change initiatives with our guests and employees, in order to divert as much material as possible from landfills.
While we are proud of the progress we have made, we are committed to doing more. We will work to achieve zero waste to landfill for our wholly owned and operated parks, resorts, and cruise line by 2030. We have a responsibility to achieve our zero waste ambition in order to protect the ecosystems and communities that host us, as well as do our part to minimize our global environmental footprint. This will take the dedicated effort of our cast members and guests alike to get us one step closer to a world without waste.
Using & Wasting Less
- Achieve zero waste to landfill for wholly owned and operated parks, resorts, and cruise line by 2030
- Reduce single use plastics in parks and resorts
- Eliminate single use plastics on cruise ships by 2025
Sourcing Lower Impact Products
Disney brings stories and characters to life through innovative and engaging products from toys and t-shirts, to books and games. We are committed to responsibly reducing the environmental impact of materials used in the creation and packaging of these items.
By evaluating the impact we can have across our company-branded product portfolio, we identified a set of materials that are consistently used in high volumes and across a number of different product categories and/or are known to have significant environmental impacts associated with their production and use: forest products including paper, wood and palm; textiles; and plastics. Our materials goals focus on reducing the environmental impacts of these materials while also helping our manufacturing network to become cleaner, safer, and healthier as a whole.
Sourcing Lower Impact Products
For Disney-branded products, by 2030:
- Use recycled, certified, or verified sustainable paper and wood
- Use plastic that contains at least 30% recycled content or a lower impact alternative material
- Design packaging for reuse, recycling, or composting
- Use recycled, sustainably sourced, or lower impact alternative textiles
- Ensure all facilities participate in the Higg index, or maintain a sustainable manufacturing certification
Building for Lower Impact
In collaboration with our various design teams across the company, and leveraging the creative expertise of our Disney Imagineers, we have established a new, rigorous set of design standards that will guide the development of all new building projects. Whether it’s an office building, resort, film stage, or attraction, we will design all new construction with a focus on minimizing waste, water, and energy in the construction and use of the building.
As one example, our new corporate campus in New York City, which includes more than one million square feet of office and production space, is being designed to LEED Platinum standards and evaluated for employee wellness certifications. The project is being designed as an all-electric building, which will be achieved through the use of high-performance facades, on-site solar panels, waste heat recovery systems, demand control, and electric heat pumps. Significant water reduction will be achieved through low-flow fixtures, on-site water capture, and reuse for industrial purposes and irrigation.
Building for Lower Impact
- Design new projects to achieve near net zero emissions, maximize water efficiency, and support zero waste operations
- Achieve 90% diversion of construction waste across new projects in the U.S. and Europe by 2030
More Environment & Conservation Impact Stories
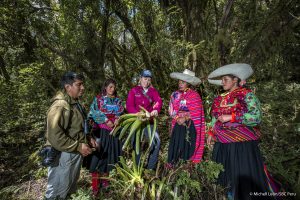
Environment
11 Trailblazing Women Honored by the Disney Conservation Fund
Read now
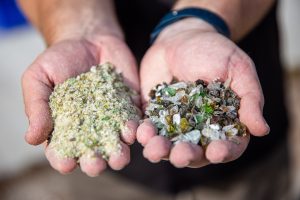
Environment
Walt Disney World Recognized for Glass Pulverizer Pilot at Disney’s Fort Wilderness Resort &...
Read now
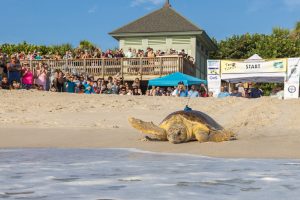
Environment
Tour de Turtles Celebrates Sea Turtles, Supernatural, and Science at Disney’s Vero Beach Resort
Read now
Environment
11 Trailblazing Women Honored by the Disney Conservation Fund
Read now
Environment
Walt Disney World Recognized for Glass Pulverizer Pilot at Disney’s Fort Wilderness Resort &...
Read now
Environment
Tour de Turtles Celebrates Sea Turtles, Supernatural, and Science at Disney’s Vero Beach Resort
Read now